Apollo Global Management 的“首席经济学家”Torsten Sløk 博士发布了这张有趣的图表,它似乎显示大型(>250 名员工)企业的 AI 采用率正在放缓:
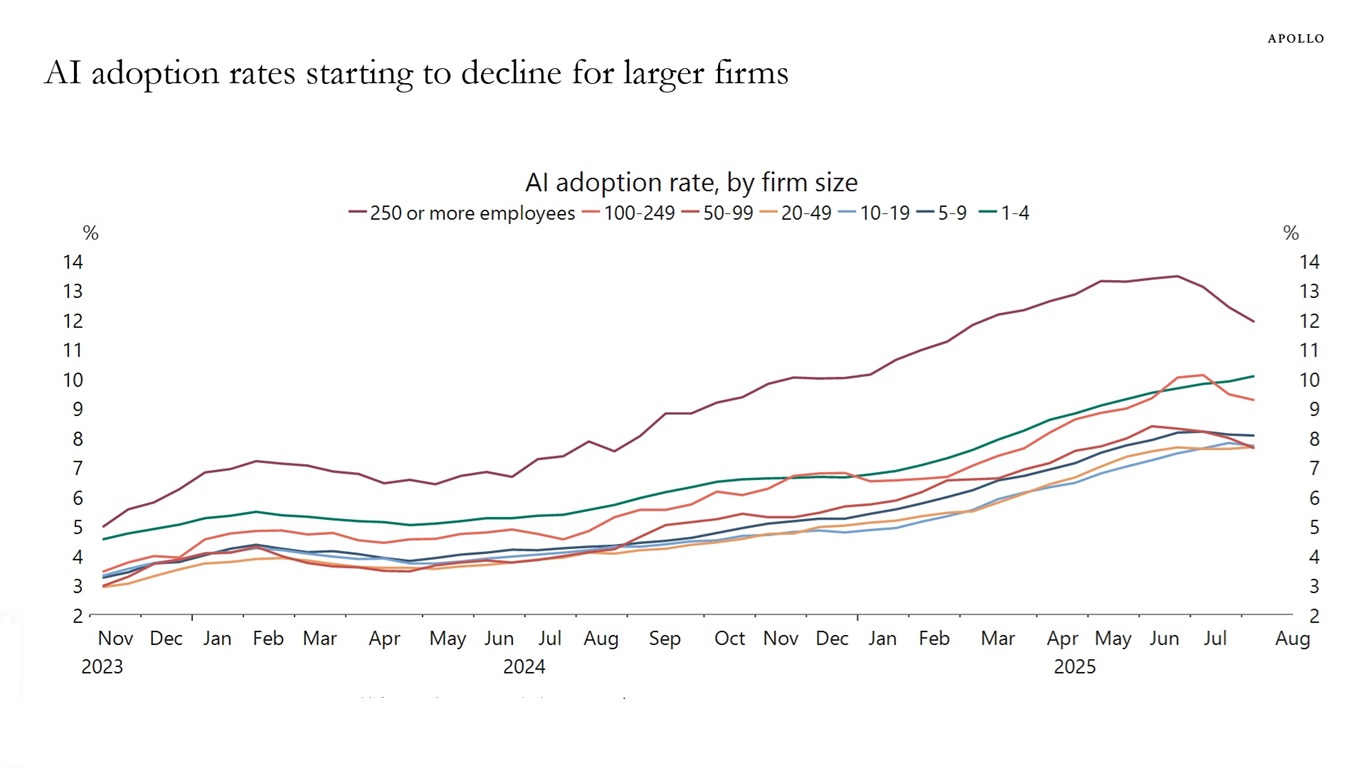
以下是随图表附上的完整说明:
美国人口普查局每两周对 120 万家企业进行一次调查,其中一个问题是:在过去两周内,该企业是否使用过机器学习、自然语言处理、虚拟代理或语音识别等 AI 工具来帮助生产商品或服务。按企业规模划分的最新数据显示,员工超过 250 人的公司的 AI 采用率一直在下降,见下图。
(我看到那张图表时的第一个想法是,我希望它代表的是Gartner 技术成熟度曲线中通往幻灭低谷的期望膨胀峰值(维基百科称其“存在很大争议,研究指出它充其量只是不一致地成立”),因为这意味着我们可能正在到达初始炒作阶段的终点,并走向启蒙斜坡。)
用 GPT-5 搜索找到美国人口普查数据
这是我第一次听说美国人口普查局在进行关于 AI 的双周(即每两周一次)调查!
我决定找出这些数字,看看能否自己重现这张图表。而且由于GPT-5 现在非常擅长搜索,我给它输入了以下提示词,看看它能做得如何:
> The US Census Bureau conducts a biweekly survey of 1.2 million firms, and one question is whether a business has used AI tools such as machine learning, natural language processing, virtual agents or voice recognition to help produce goods or services in the past two weeks. Recent data by firm size shows that AI adoption has been declining among companies with more than 250 employees, see chart below.
Find me that original data
它花了 1 分 19 秒找到了我正好需要的东西:
以下是该数据系列的美国人口普查局原始来源:
- BTOS“就业规模类别”时间序列(XLSX)——对“在过去两周内,该企业是否使用人工智能(AI)生产商品或服务?”回答是的企业所占比例的双周数据,按企业规模分组(包括250+ 名员工)。覆盖范围:2023 年 9 月 11 日 → 2025 年 8 月 24 日。(Census.gov)[...]
那个人口普查页面一点也不明显。幸好 GPT-5 提示了我“就业规模类别”文件,就是这个链接:
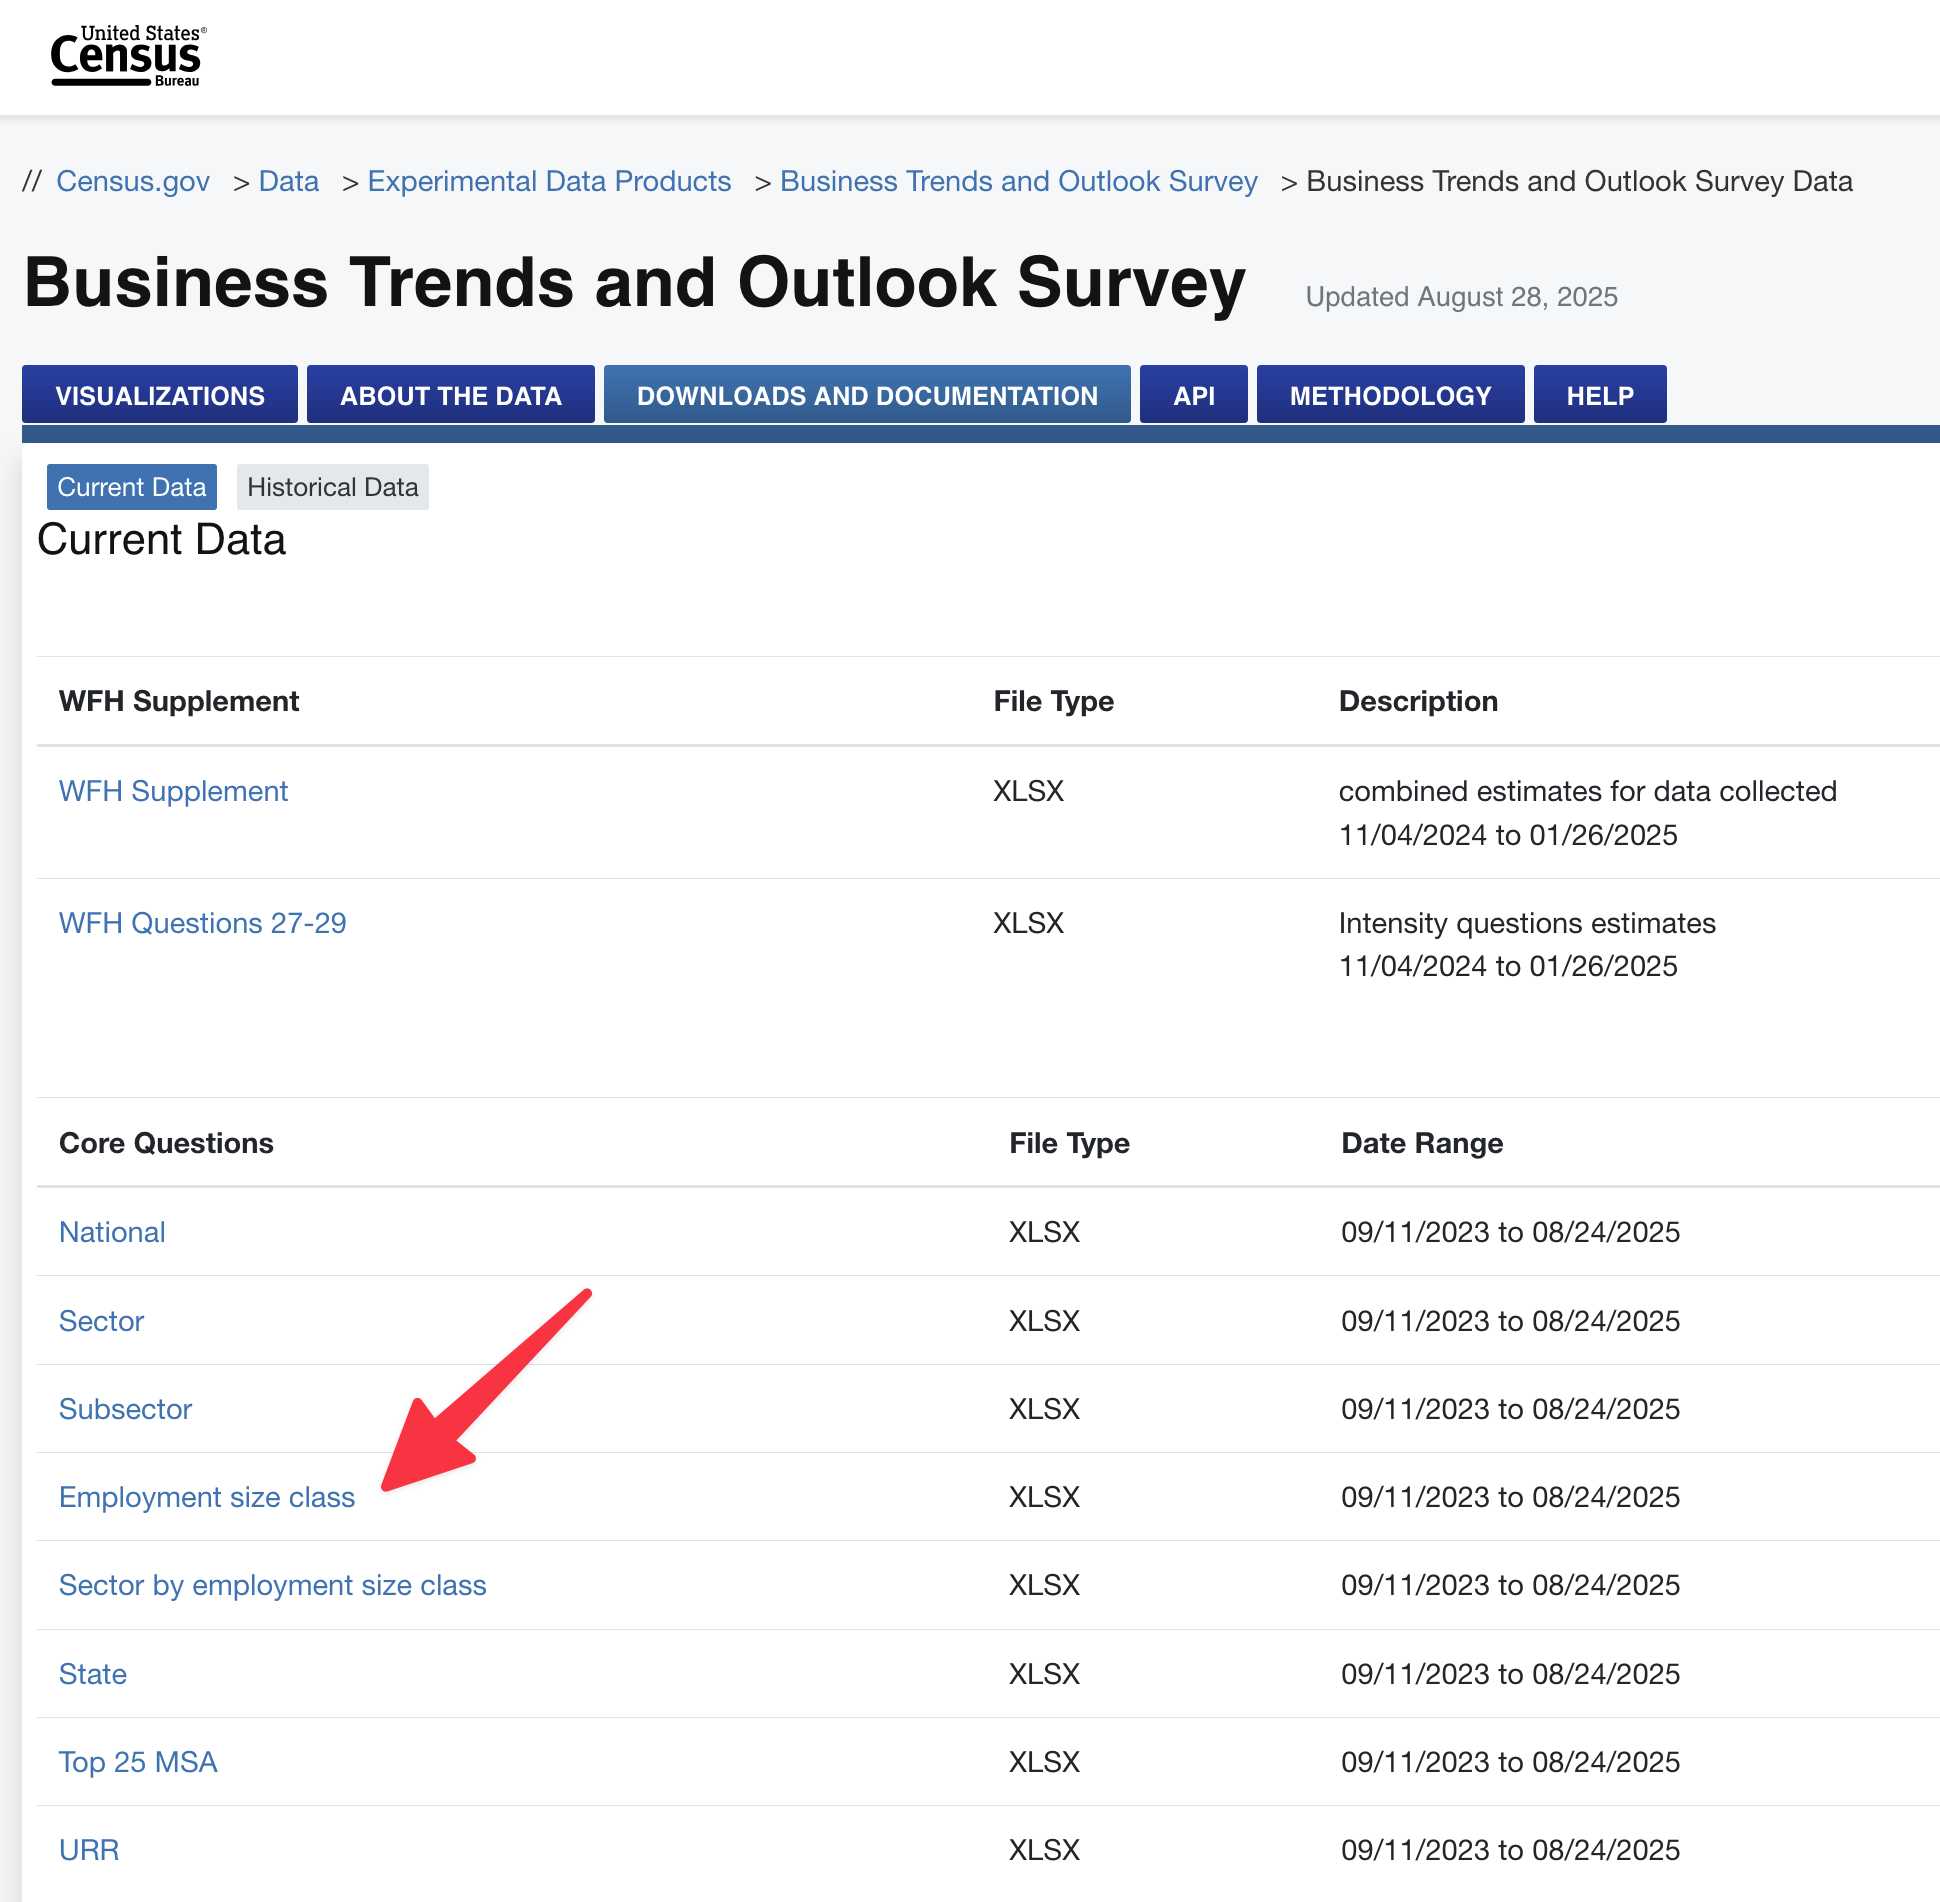
于是我下载了那个文件,并确认它确实是一个包含我想要的数据的电子表格(夹杂在各种其他调查问题之中)。这是我下载的文件的374KB XLSX 副本。
用 GPT-5 代码解释器重现图表
那么我现在该拿它怎么办?我决定看看 GPT-5 能否使用其代码解释器工具中运行的 Python,把这个电子表格重新变成那张原始图表。
于是我把 XLSX 文件上传回 ChatGPT,放入 Apollo 图表的截图,并提示:
Use this data to recreate this chart using python
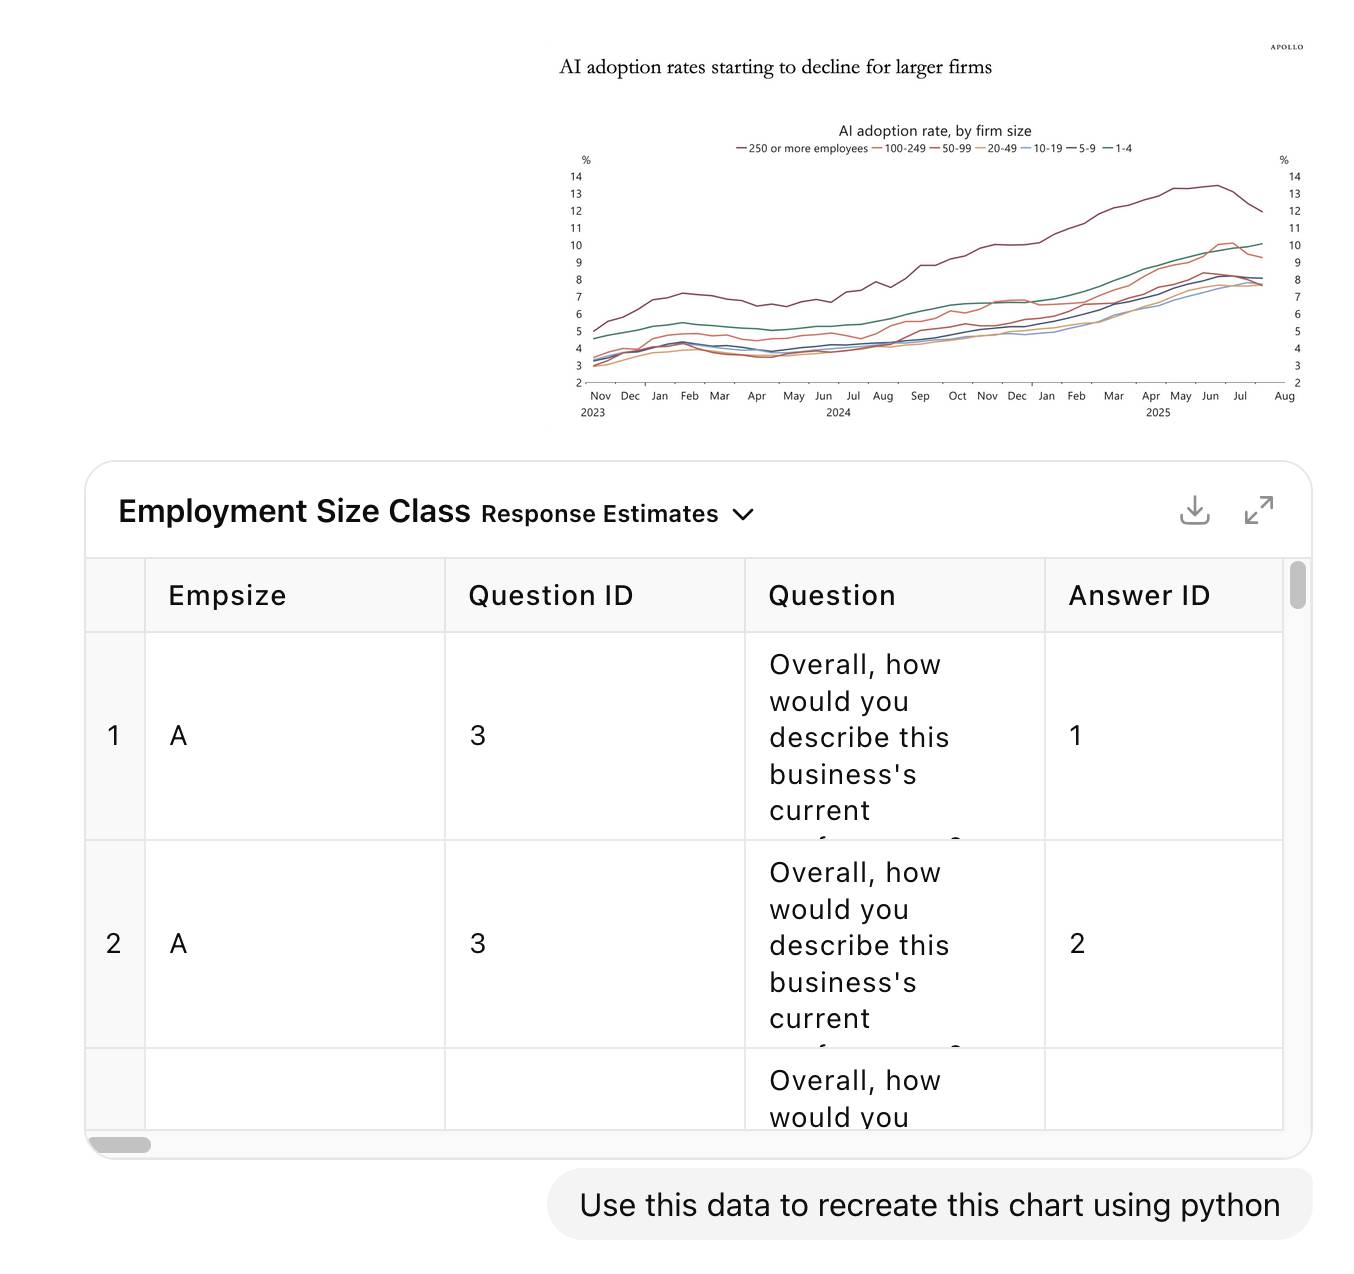
我觉得这是个相当高的要求,但把大挑战抛给 LLM 总是值得的,可以从它的表现中学习。
它真的为此非常努力。我没有精确计时,但它在 5 个不同的思考块中花了至少 7 分钟进行“推理”,其间穿插了十多次 Python 分析会话。它使用pandas和numpy来探索上传的电子表格并找到正确的数字,然后尝试了几次用matplotlib绘图。
据我所知,ChatGPT 中的 GPT-5 现在可以把它创建的图表反馈到自己的视觉模型中,因为它似乎渲染了一张损坏的(空白)图表,然后继续尝试让它正常工作。
它在电子表格的最后一个标签页中找到了一个数据字典,并用它构建了一个查找表,将字母A到G与实际员工规模分组对应起来。
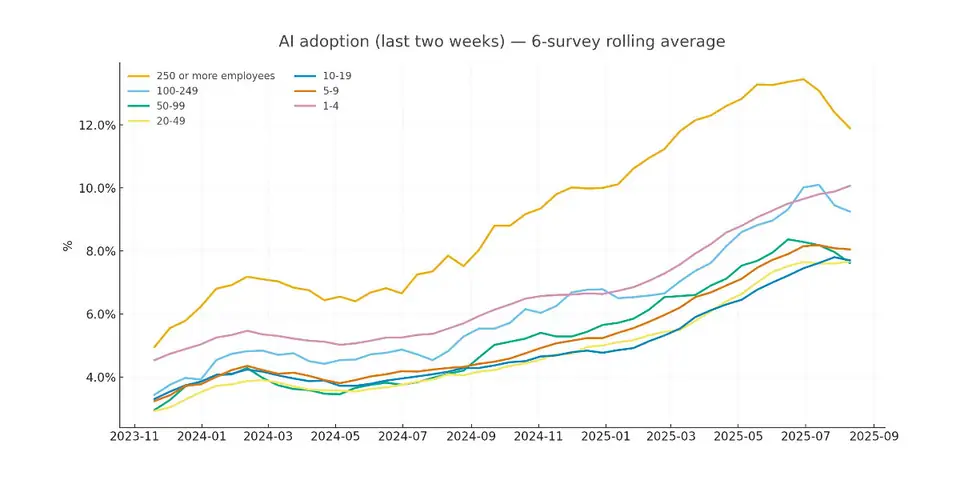
在过程结束时,它输出了这张图表:
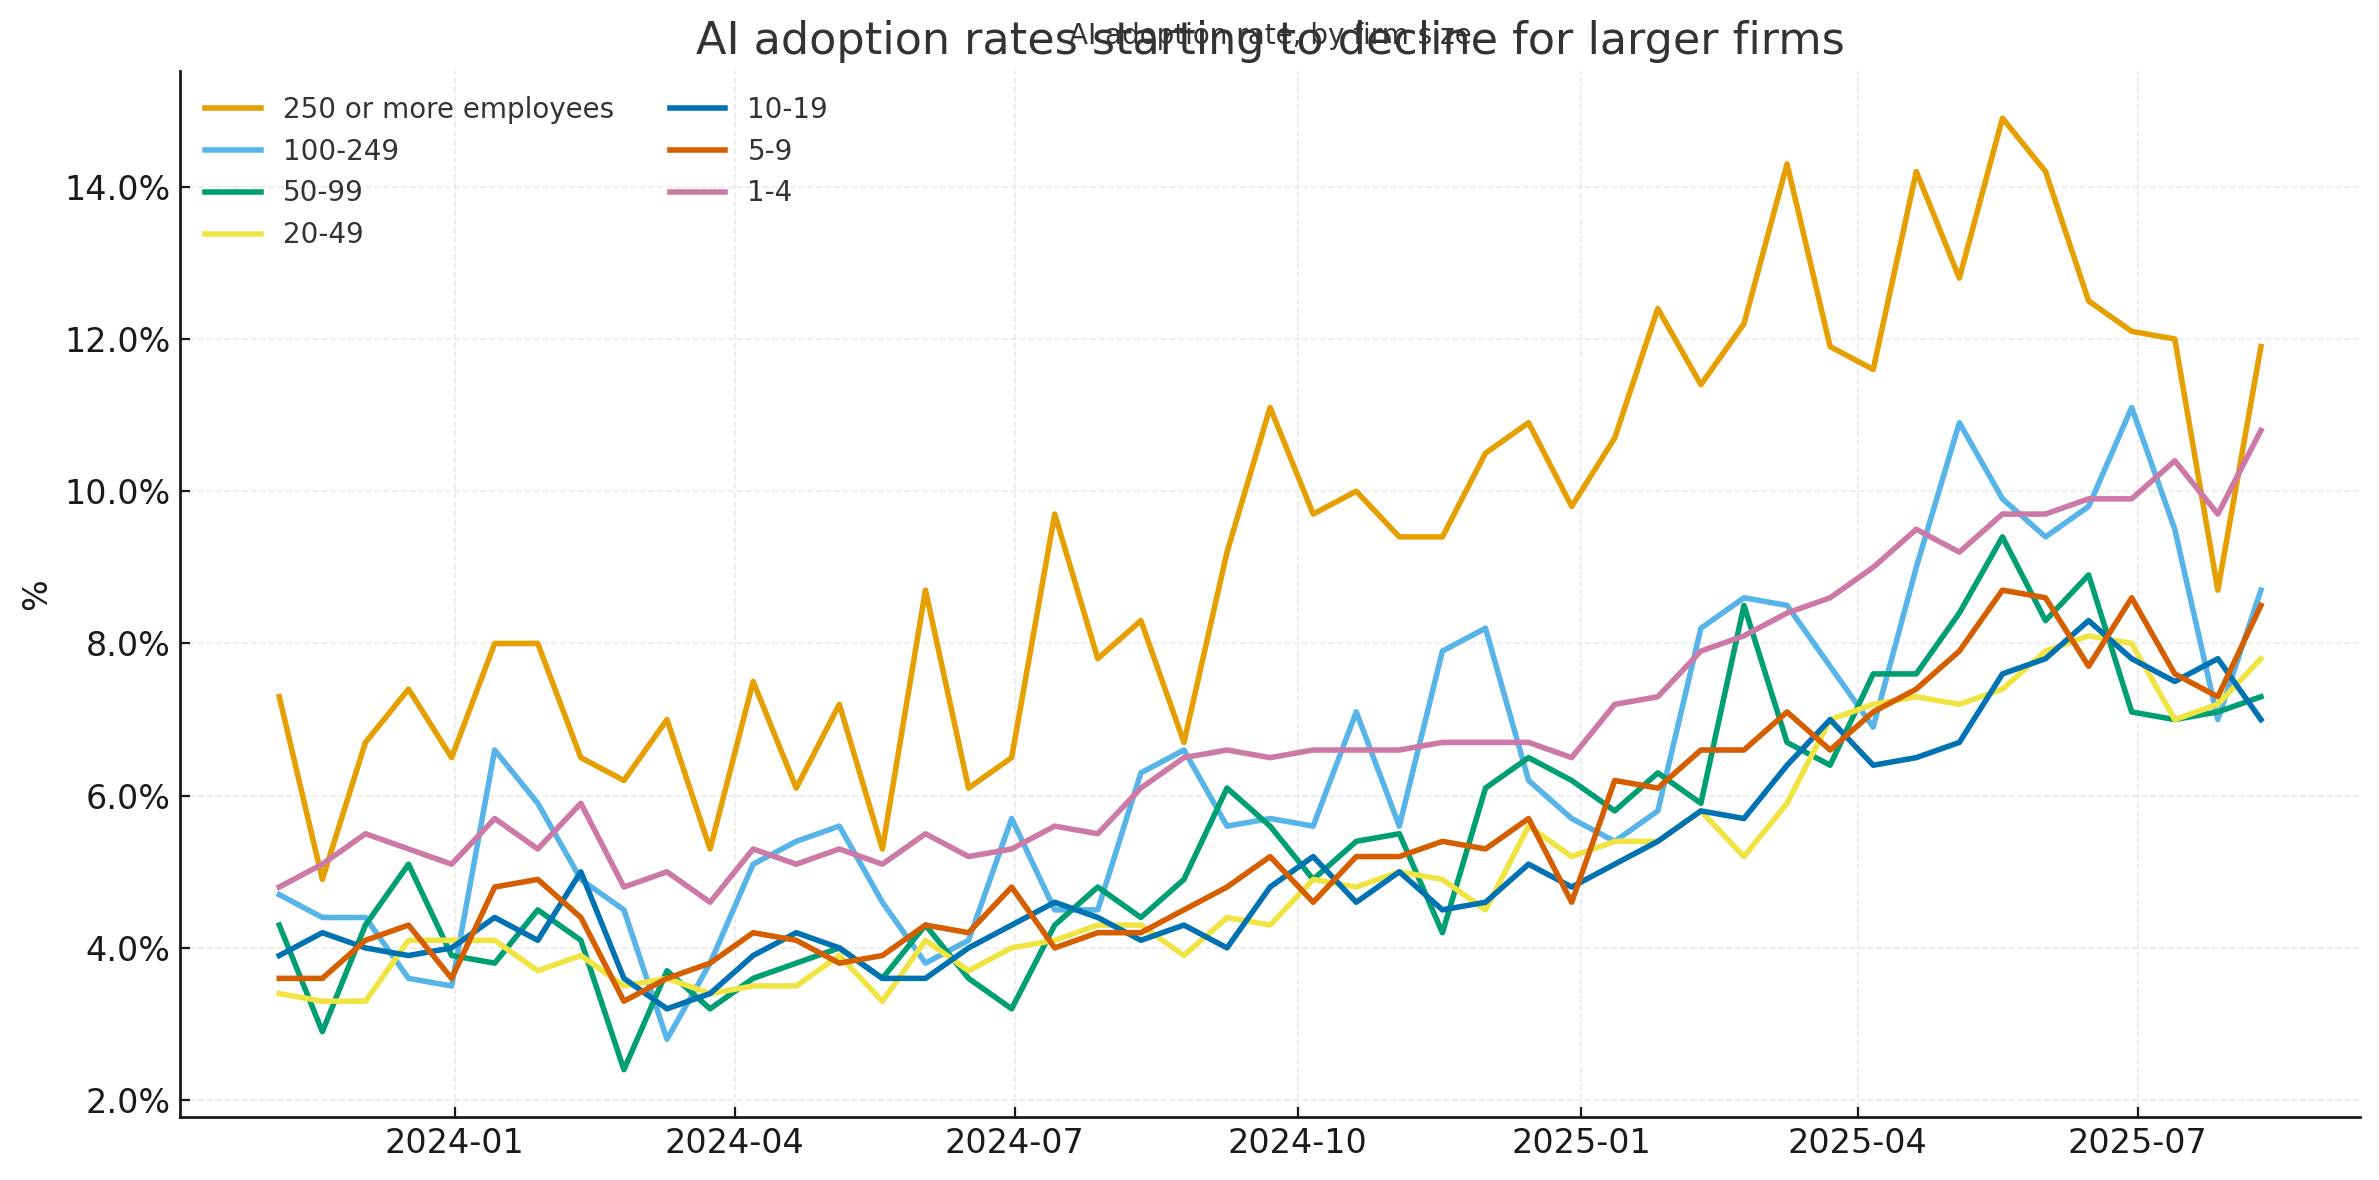
乍一看,我以为它做得很完美……但随后我把图表与 Apollo 原图更仔细地比较,发现了一些明显的差异。GPT-5 的图表峰值达到 14.5%,而 Apollo 的最高值更像是 13.5%。GPT-5 的图表更尖锐——最有趣的是,它在最后一个数据点包含了明显的上升,而 Apollo 的则呈下降趋势。
我决定是时候看看实际数据了。我在 Numbers 中打开了电子表格,找到 AI 问题列并手动检查了它们。它们似乎与 GPT-5 图表的结果相符——那么为什么与 Apollo 的不同呢?
然后我注意到 Apollo 图表中一个被我裁剪出原始截图的关键细节!
注:数据为六次调查的移动平均值。
于是我告诉 ChatGPT:
Do the first question, plot it as a six survey rolling average
我之所以问第一个问题,是因为调查电子表格中原来有两个相关问题。
- 在过去两周内,该企业是否使用人工智能(AI)生产商品或服务?(AI 示例:机器学习、自然语言处理、虚拟代理、语音识别等)
- 在接下来的六个月内,您认为该企业是否会使用人工智能(AI)生产商品或服务?(AI 示例:机器学习、自然语言处理、虚拟代理、语音识别等)
它又运行了一会儿,将这段代码添加到脚本中:
# Compute 6-survey rolling average (biweekly cadence → ~12 weeks)
rolled = wide.rolling(window=6, min_periods=6).mean()
然后生成了这张图表(在我告诉它修复标题中的小问题之后):
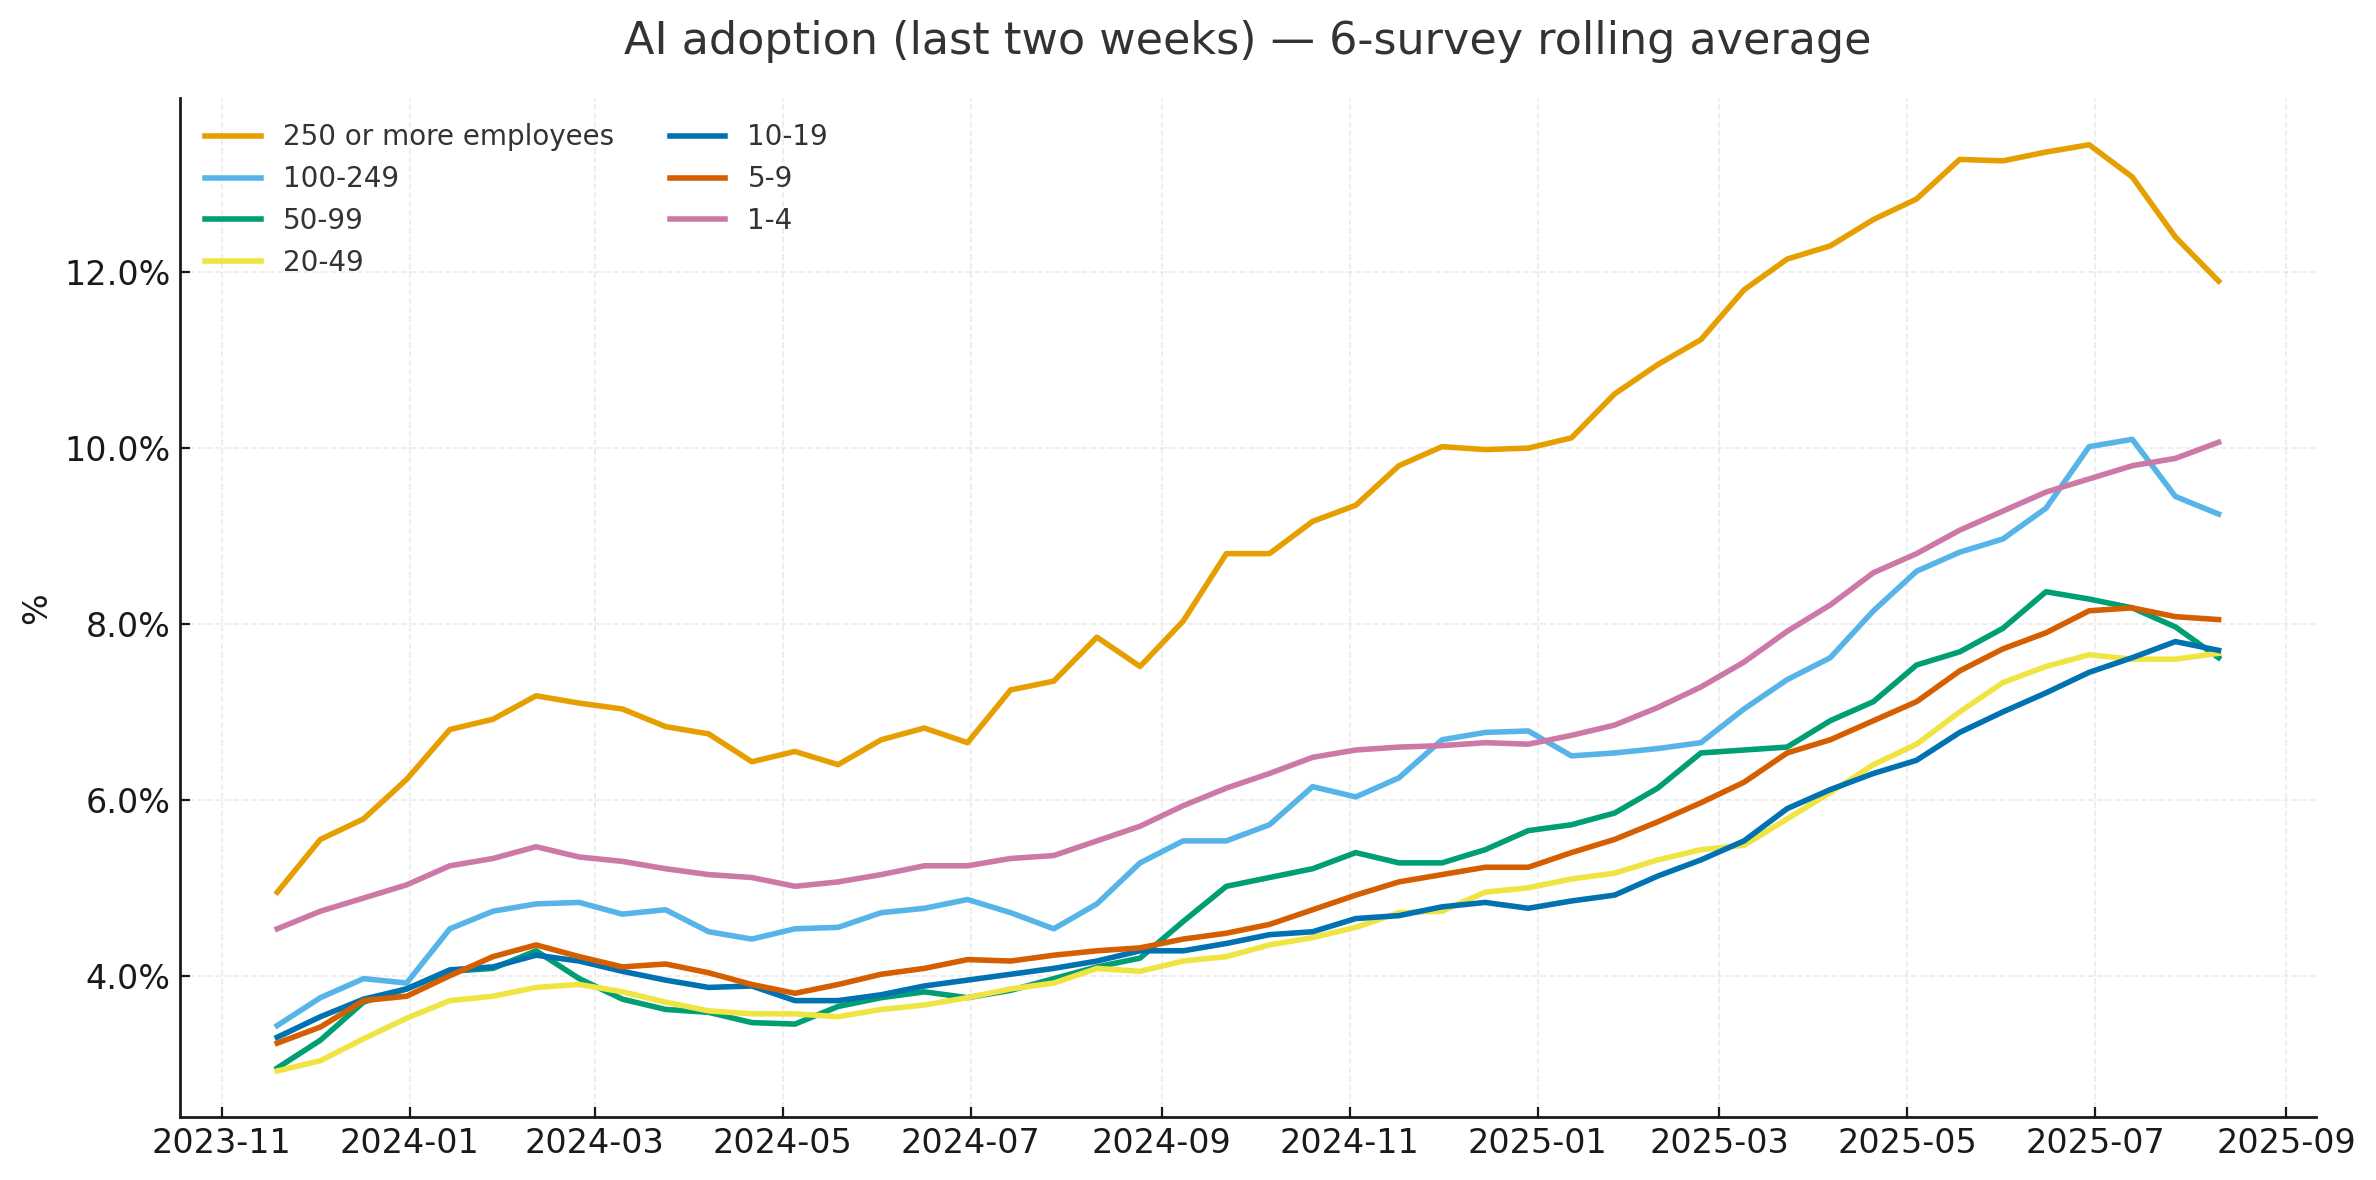
我认为它做到了!这与 Apollo 的原图非常匹配,使用来自美国人口普查局相同底层源数据的 matplotlib 和 pandas 重新创建。
以下是它编写的完整 Python 代码,我认为相当可读(就 Pandas 代码而言):
import pandas as pd
import matplotlib.pyplot as plt
from matplotlib.ticker import PercentFormatter

path = "/mnt/data/Employment Size Class.xlsx"

resp = pd.read_excel(path, sheet_name="Response Estimates")
dates = pd.read_excel(path, sheet_name="Collection and Reference Dates")

is_current = resp["Question"].astype(str).str.strip().str.startswith("In the last two weeks")
ai_yes = resp[is_current & resp["Answer"].astype(str).str.strip().str.lower().eq("yes")].copy()

code_to_bucket = {"A":"1-4","B":"5-9","C":"10-19","D":"20-49","E":"50-99","F":"100-249","G":"250 or more employees"}
ai_yes["Bucket"] = ai_yes["Empsize"].map(code_to_bucket)

period_cols = [c for c in ai_yes.columns if str(c).isdigit() and len(str(c))==6]
long = ai_yes.melt(id_vars=["Bucket"], value_vars=period_cols, var_name="Smpdt", value_name="value")

dates["Smpdt"] = dates["Smpdt"].astype(str)
long["Smpdt"] = long["Smpdt"].astype(str)
merged = long.merge(dates[["Smpdt","Ref End"]], on="Smpdt", how="left")
merged["date"] = pd.to_datetime(merged["Ref End"], errors="coerce")

merged["value"] = pd.to_numeric(long["value"].astype(str).str.replace("%","",regex=False).str.strip(), errors="coerce")

order = ["250 or more employees","100-249","50-99","20-49","10-19","5-9","1-4"]
wide = merged.pivot_table(index="date", columns="Bucket", values="value", aggfunc="mean").sort_index()
wide = wide[[c for c in order if c in wide.columns]]
rolled = wide.rolling(window=6, min_periods=6).mean()

start, end = pd.Timestamp("2023-11-01"), pd.Timestamp("2025-08-31")
rolled_win = rolled.loc[(rolled.index >= start) & (rolled.index <= end)]

fig, ax = plt.subplots(figsize=(12, 6))
for col in order:
    if col in rolled_win.columns:
        ax.plot(rolled_win.index, rolled_win[col], label=col, linewidth=2)

ax.set_title("AI adoption (last two weeks) — 6‑survey rolling average", pad=16)
ax.yaxis.set_major_formatter(PercentFormatter(100))
ax.set_ylabel("%")
ax.set_xlabel("")
ax.grid(True, alpha=0.25, linestyle="--")
ax.legend(title=None, loc="upper left", ncols=2, frameon=False)
plt.tight_layout()

png_path = "/mnt/data/ai_adoption_rolling6_by_firm_size.png"
svg_path = "/mnt/data/ai_adoption_rolling6_by_firm_size.svg"
plt.savefig(png_path, dpi=200, bbox_inches="tight")
plt.savefig(svg_path, bbox_inches="tight")
我喜欢它在我甚至没有要求的情况下生成了图表的 SVG 版本。
您可以访问 ChatGPT 对话记录 查看它所做的所有操作的完整细节。
使用 Pyodide 在客户端渲染该图表
我还有一个挑战要尝试。我能否使用 Pyodide 在浏览器中完全渲染同一张图表?Pyodide 可以执行 Pandas 和 Matplotlib。
我启动了一个新的 ChatGPT GPT-5 会话并提示:
Build a canvas that loads Pyodide and uses it to render an example bar chart with pandas and matplotlib and then displays that on the page
我在这里的目标只是看看能否获得一个图表渲染的概念验证,最好使用 ChatGPT 的 Canvas 功能。Canvas 是 OpenAI 版本的 Claude Artifacts,它允许模型直接在 ChatGPT 界面中编写并执行 HTML 和 JavaScript。
它成功了!这里是对话记录,这里是它为我构建的内容,已导出到我的 tools.simonwillison.net GitHub Pages 站点(源代码在这里)。
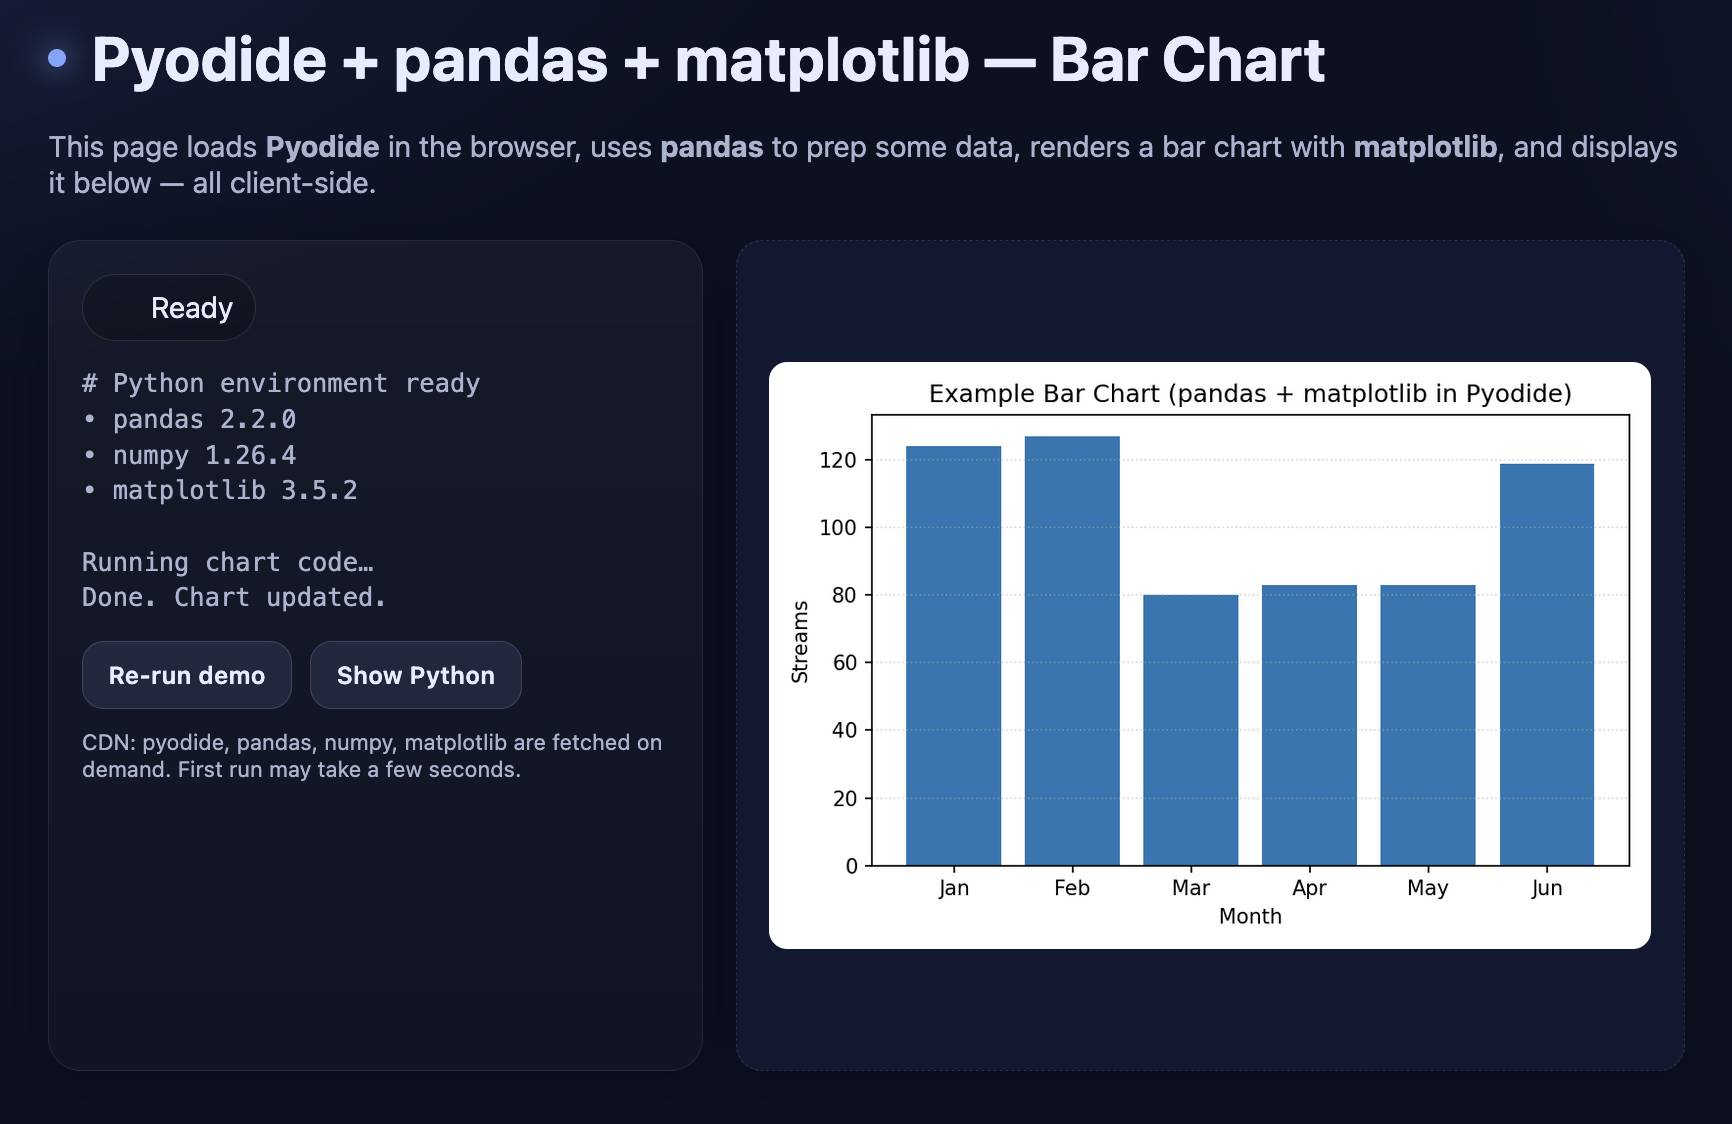
我现在已经向自己证明,我可以直接在浏览器中渲染那些 Python 图表。下一步:重新创建 Apollo 图表。
我知道它需要一种加载支持 CORS 的电子表格的方法。我将我的副本上传到我的 /static/cors-allow/2025/... 目录(在 Cloudflare 中配置为提供 CORS 头),粘贴了之前完成的绘图代码,并告诉 ChatGPT:
Now update it to have less explanatory text and a less exciting design (black on white is fine) and run the equivalent of this:(... 粘贴了之前的 Python 代码 ...)
Load the XLSX sheet from https://static.simonwillison.net/static/cors-allow/2025/Employment-Size-Class-Sep-2025.xlsx
它没有完全工作——我遇到了一个关于 openpyxl 的错误,我手动研究了修复方法并提示:
Use await micropip.install("openpyxl") to install openpyxl - instead of using loadPackage
我不得不粘贴另一条错误消息:
zipfile.BadZipFile: File is not a zip file
然后是一个关于 SyntaxError: unmatched ')' 和 TypeError: Legend.__init__() got an unexpected keyword argument 'ncols' 的错误——复制粘贴错误消息仍然是 vibe-coding 循环中令人沮丧但必要的一部分。
... 但有了这些修复,生成的代码工作了!访问 tools.simonwillison.net/ai-adoption 查看最终结果:
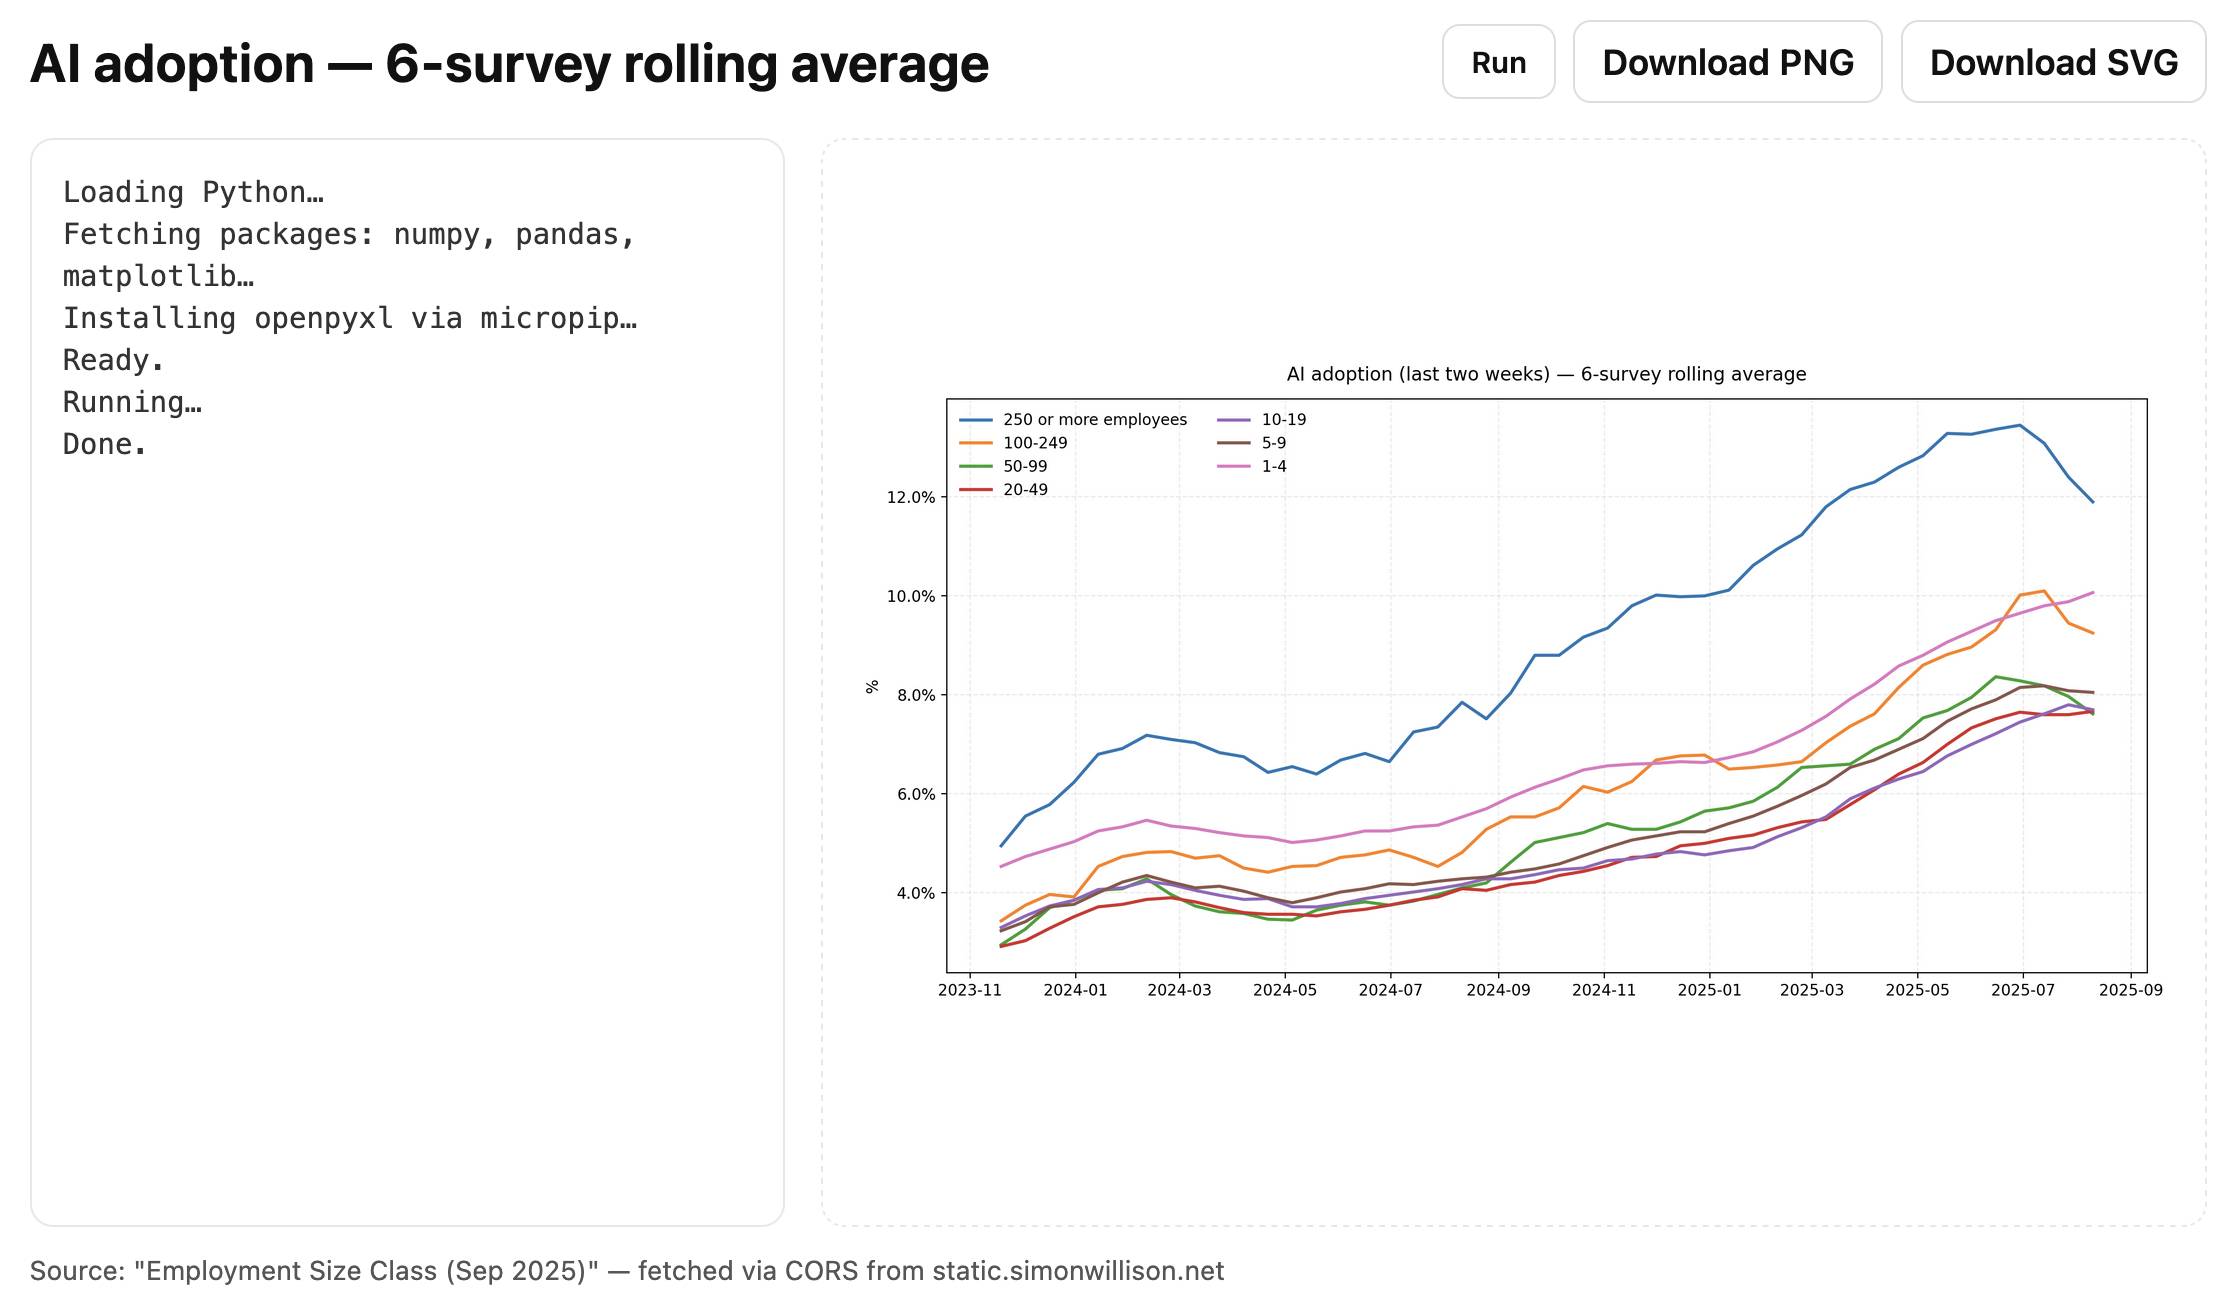
这是该页面的代码,170 行,包括 HTML、CSS、JavaScript 和 Python。
我从中学到了什么
这是又一次由好奇心驱动的调查,变成了一整套有用的经验教训。
GPT-5 非常擅长查找美国人口普查数据,无论他们的网站对于不经常处理他们数据的人来说有多难理解
它能够非常好地将数据 + 图表截图转化为使用代码解释器、Pandas 和 matplotlib 重新创建的图表
通过 Pyodide 在浏览器中运行 Python + matplotlib 非常容易,只需要几十行代码
使用
pyfetch和openpyxl将 XLSX 工作表获取到 Pyodide 中只是一个小额外步骤:import micropip await micropip.install("openpyxl") from pyodide.http import pyfetch resp_fetch = await pyfetch(URL) wb_bytes = await resp_fetch.bytes() xf = pd.ExcelFile(io.BytesIO(wb_bytes), engine='openpyxl')另一个对我来说是新的模式:你可以从 Pyodide 代码中将图像渲染到 DOM,像这样:
from js import document
document.getElementById('plot').src = 'data:image/png;base64,' + img_b64
我将来肯定会再次使用这些技术。
更新:巧合的是,Claude 在我发布这个故事当天晚些时候发布了他们自己升级版的 ChatGPT Code Interpreter 等效产品,所以我运行了相同的图表重新创建实验,针对 Claude Sonnet 4 看看它如何比较。